
Answer in brief
A journey map shows the process one person goes through to reach a goal with your business: the phases, what they do, think and feel, the touchpoints, and the opportunities to improve. It is worth making only when it rests on research and ends in fixes that each have an owner and a metric.
What a customer journey map shows and what it is made of
Nielsen Norman Group, the usability research firm, gives the shortest workable definition: a journey map is a visualization of the process a person goes through in order to accomplish a goal. A customer journey map applies that to one customer and one business. It follows how someone notices a need, chooses you, buys and decides whether to come back. Wikipedia's entry on customer experience describes the same tool as a way for managers to see the interactions between a firm and its customers, spot opportunities and reduce friction.
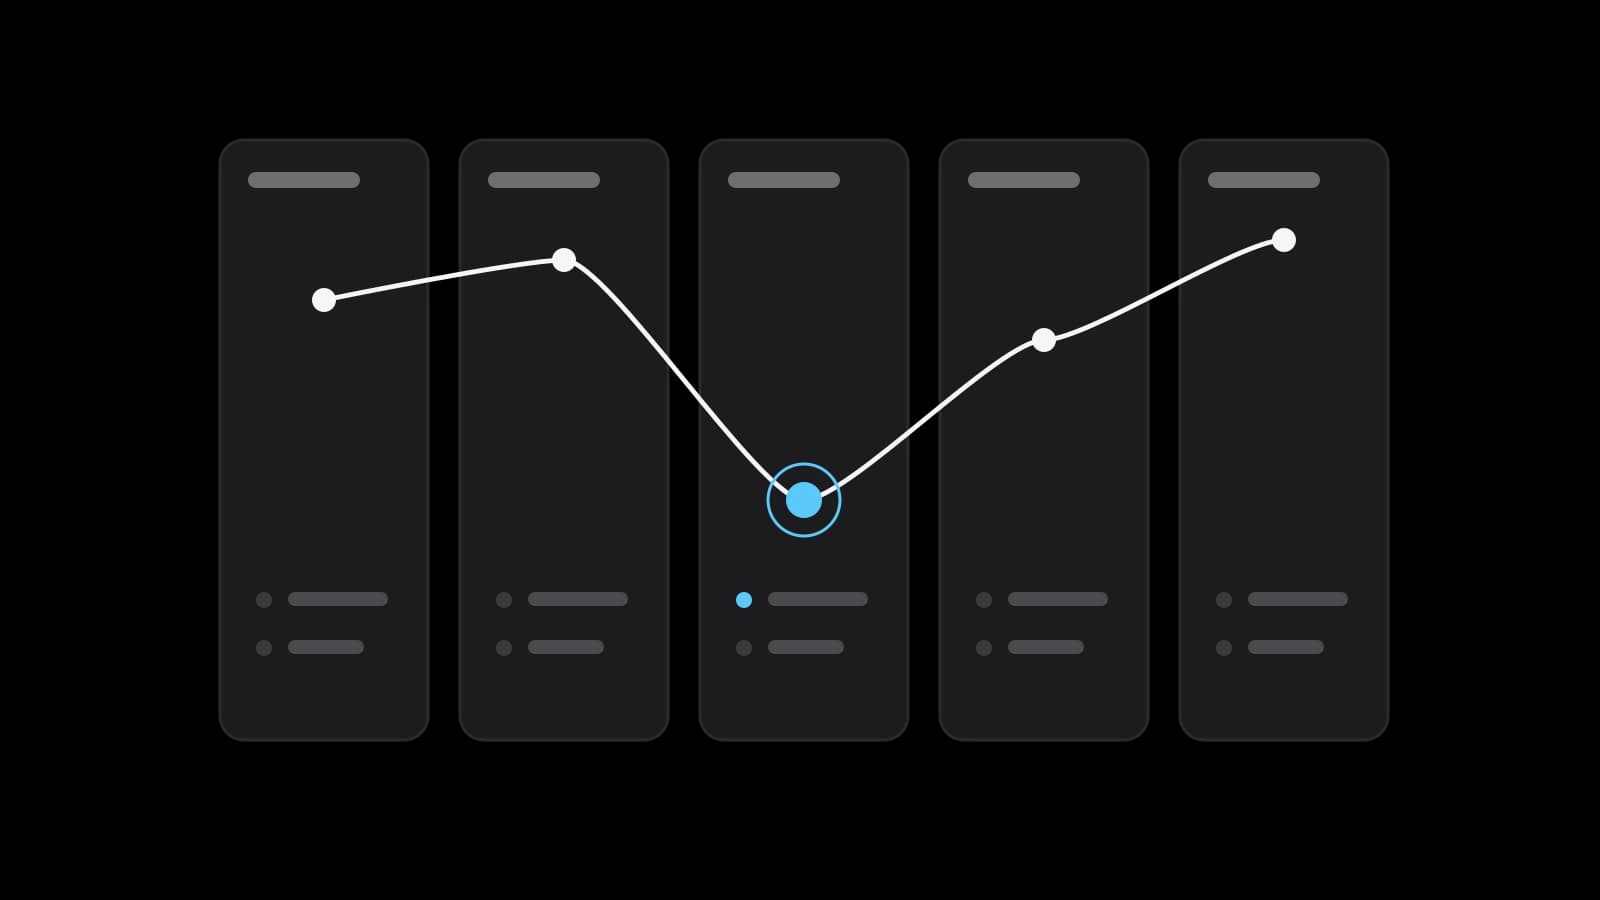
The parts are stable. The actor is one persona, and Nielsen Norman Group insists on one point of view per map. The scenario is the situation, paired with the actor's expectations of it. Phases are the high-level stages that organise everything else, and they change with the scenario. Inside each phase sit the actions, the mindsets, meaning thoughts, questions and information needs best taken from real quotes, and a single emotion line that shows the highs and lows.
Below them come touchpoints, which Wikipedia defines as the moments in which firms can interact with their current or potential customers, and the channels where they happen. The last row holds opportunities, with internal ownership and metrics attached. There is no fixed number of customer journey stages either. The five often quoted, from need recognition to post-purchase behaviour, come from the buyer decision process, which Wikipedia traces to John Dewey's book How We Think of 1910.
Customer journey map vs service blueprint, experience map and story map
The Nielsen Norman Group comparison sheet separates four often confused maps by scope. A journey map is tied to a specific customer and a specific product or service. An experience map describes a general human process, such as moving house, without any product in it. An empathy map is not a sequence at all: it collects one persona's thoughts and feelings in four boxes.
The service blueprint is older than most of these. Wikipedia credits G. Lynn Shostack, a bank executive, who described it in the Harvard Business Review in 1984. Nielsen Norman Group calls it part two of the journey map: it takes the customer's steps and shows what staff do frontstage, what happens backstage, the support processes and the evidence the customer touches. The practical rule is simple: the journey map finds where the customer suffers, the blueprint finds why inside the company.
A user story map looks the other way. Nielsen Norman Group describes it as a lean method from Agile teams that takes the perspective of the product, in three levels of activities, steps and details. A finished journey map can grow into one by adding those levels, which is often the cleanest route from a workshop wall to a sprint plan.
Current-state and future-state maps, and what a template should hold
Nielsen Norman Group separates two kinds. A current-state map shows the experience customers have with your product or company as it exists today, with its pain points and dips. A future-state map shows the best-case journey for an existing product, or the journey of one that does not exist yet. In its survey of 343 practitioners, 89% used journey mapping to evaluate the current experience of existing products and 73% to envision a better future state. The firm notes the sample came from its own readers.
The order matters. Nielsen Norman Group recommends a current-state map first, to see the existing opportunities, and a future-state map after it, so new ideas are judged against a real baseline. A customer journey map template only gives you the grid: phases across the top, then rows for actions, thoughts, the emotion line, touchpoints, opportunities and owners. It cannot fill the cells, and empty cells invite guesses that look like findings once typed.
The research behind the map and why a guessed one misleads
Most evidence already exists in the business. The GOV.UK Service Manual, describing discovery work in the UK public sector, lists observing people, interviews and visits, existing data such as analytics, back-office workflow and support logs, and previous research. For a company that means support tickets, chat transcripts, public reviews, sales call notes, refund reasons and site paths. Rules on recording calls and reusing customer messages differ between the EU, the UK, US states and the Gulf; check yours with a specialist.
Nielsen Norman Group names two ways to start. Assumption-first begins with a cross-functional workshop of one to three days; research-first begins with primary research led by the design team, which it calls lengthy and expensive. Among the practitioners it surveyed, 62% worked hypothesis-first and 35% research-first. The firm also names the risk plainly: the process often stops before validation occurs. Its five-step guide treats the assumption map as a draft and says six to eight participants are enough to begin external interviews.
A guessed map fails predictably. The team draws the steps it controls, skips what happens before the first contact and after delivery, and writes its own feelings into the emotion line. Nielsen Norman Group puts it bluntly: maps should be truthful narratives, not fairy tales, and quantitative data alone cannot build a story.
How to create a customer journey map in six steps
First, set the goal and the lens: one business goal, one persona, one scenario, current state. Half a day is enough if the owner is in the room. Second, gather internal evidence: a month of support messages, reviews, sales notes and the analytics paths for the scenario; allow two or three days. Third, a one-day workshop with sales, support and delivery turns this into a hypothesis map.
Fourth, test the draft with six to eight interviews of recent customers, including one who left; plan a week for scheduling. Fifth, synthesise: rewrite the thoughts in customers' own words, redraw the emotion line, list the pain points and opportunities, and give each one an owner. Sixth, only now draw the final version, and present it where decisions are taken.
For comparison, Nielsen Norman Group's survey reported a mean of 73.8 hours for the whole process, with the most time on external research at 20.6 hours and synthesis at 16.4. Companies under 500 employees reported 64.9 hours against 87 at larger ones, a gap the firm calls not statistically significant. When the problem is already known, its FAQ describes a quick 60 to 90 minute working session instead of the full cycle.
A customer journey map example for an online furniture store
Take an illustrative online store selling sofas and tables. The actor is a couple furnishing their first flat; the scenario is replacing a worn sofa within a month; the expectation is to know the real size, the full price with delivery and the date it arrives. The phases run from noticing the need through comparing, paying, waiting and delivery to a second purchase. Touchpoints include search, product pages, a fabric sample, checkout, order emails and the courier's call.
The emotion line rises when the fabric sample arrives quickly and drops three times. The first dip comes while comparing, because the packed dimensions sit in a separate file and nobody knows whether the box fits the stairwell. The deepest one is after payment, when the delivery promise is a range of weeks with no update, and customers start writing to support. The third is delivery day, when the courier calls with little notice. That middle low is the moment of truth for a second purchase.
Three fixes, ranked by effort against impact. Cheapest and strongest: status messages at three points, when the order ships, when the date is fixed and the day before with a time window; the metric is the share of support contacts about order status. Next: packed dimensions and a doorway check on every product page, measured by returns marked as not fitting. Hardest: delivery slots booked at checkout, which needs the courier partner to change, measured by rescheduled deliveries.
Turning the journey map into a backlog and measuring the fixes
Nielsen Norman Group lists seven ways to read a finished map. Start with the lowest points, because through the peak-end effect the lowest moment weighs heavily on how the whole journey is remembered. Then check channel changes, where friction often appears, unnecessary touchpoints, time per phase and moments of truth. Each opportunity then gets one owner and one metric; in the firm's words, without ownership no one has responsibility or empowerment to change anything.
The GOV.UK Service Manual takes the same view for public services. Its guidance on mapping a user's whole problem notes that complicated journeys often cut across organisational boundaries; becoming a childminder involves Ofsted, HMRC and the DBS. It tells teams to look for dead ends, confusing or duplicative content, and online and offline steps that do not join up. Content changes are its quick wins, and the improved journey map can serve as the team's backlog. For a shop, couriers and payment providers sit on the journey in the same way.
A map with no business goal behind it, Nielsen Norman Group warns, will not result in applicable insight. Drawing too early produces a beautiful yet flawed map. Several personas on one sheet blur the story, and a graphic sent by email changes nothing. The map is never finished: compare each metric before and after its fix, and reopen it every quarter.
Mapping the journey in-house or ordering it within a strategy
A template and your own team work when there is one main product, customers can be reached for interviews and one person owns the fixes. The real cost is time; the survey figure above is a fair yardstick. Ordering makes more sense when the map has to sit inside wider choices about whom to sell to, what to offer and which channels to fund. Either way, prepare the goal, the persona and scenario, exports of support messages and reviews, sales notes, analytics access and the name of the person who will own the result.
VITON13 Studio handles this as a marketing strategy project and confirms the scope in writing before work starts. The service page lists it from $93 with AI assistance or from $113 human-led, delivered in 7 to 12 working days with 2 revision rounds. The deliverables named there are a market diagnosis, an offer and audience map and a 90-day channel plan. If you want the journey map itself as a separate deliverable, say so when the scope is agreed.
Practical checklist
- Write down the business goal, the one persona and the one scenario the map will cover.
- Export a month of support messages, reviews and sales notes for that scenario before any workshop.
- Interview six to eight recent customers, including at least one who did not buy again.
- Give every opportunity on the map one owner, one metric and a date for the next check.
- Reopen the map every quarter and compare each metric with its value before the fix.
Questions and answers
How many personas should one journey map cover?
One. A map that mixes a first-time buyer and a trade customer averages two different stories into one that fits neither. Make a separate sheet for each persona and scenario, and start with the one tied to the business goal you care about most this quarter.
What are the five stages of a customer journey?
The common five are need recognition, information search, evaluation of alternatives, the purchase decision and post-purchase behaviour, from the classic buyer decision process. They are a starting point. Your own phases should come from research, and a service business often needs extra ones such as onboarding or renewal.
Can a journey map be built from analytics data alone?
No. Analytics tells you at which step people drop out and how long they stay, but not what they were thinking or why they gave up. Use it to choose where to look, then hear the reasons from interviews, support messages and reviews.
How long does journey mapping take for a small team?
A plan of roughly three working weeks part-time is realistic: a few days of internal evidence, a one-day workshop, a week of interviews and a few days of synthesis. A quick working session of about an hour and a half is enough only when the problem is already well understood.
When should a team make a service blueprint instead of a journey map?
After the journey map, not instead of it. Once you know where customers struggle, a blueprint shows which staff actions, back-office steps and systems sit behind that moment, so the fix lands on the right team and process.