
Answer in brief
Comparable photos can show a change in a glacier’s visible margin. A change in whiteness alone cannot distinguish glacier retreat from seasonal snowmelt; dates, viewpoint and snow conditions must also be checked.
What do these glacier photos actually show?
Comparable photos can show a change in a glacier’s visible margin. A change in whiteness alone cannot distinguish glacier retreat from seasonal snowmelt; dates, viewpoint and snow conditions must also be checked. The white area can include fresh snow, and a different crop can hide part of the ice. Start with the identifiable margin of the same glacier and fixed landmarks in the surrounding rock. That gives the comparison a specific claim to test, rather than relying on a dramatic change in the mountain’s appearance.
This is an interpretation guide checked on 8 October 2026, not a report of a new glacier measurement. Autumn sharing often puts dramatic mountain pairs into circulation, but the date on a social post is not the date of either photograph. Before sharing, find the original image records and read the complete caption. A caption that identifies the glacier, photographer, observation dates and viewpoint gives you a starting point. An unattributed collage gives you a question to investigate, rather than a dependable result.
Keep three claims separate while reading: visible landscape change, measured glacier area change, and changes in ice volume or mass. They require different evidence. A well-controlled image pair can be excellent evidence for the first, while still lacking the measurements needed for the other two.
Snow cover and glacier ice tell different stories
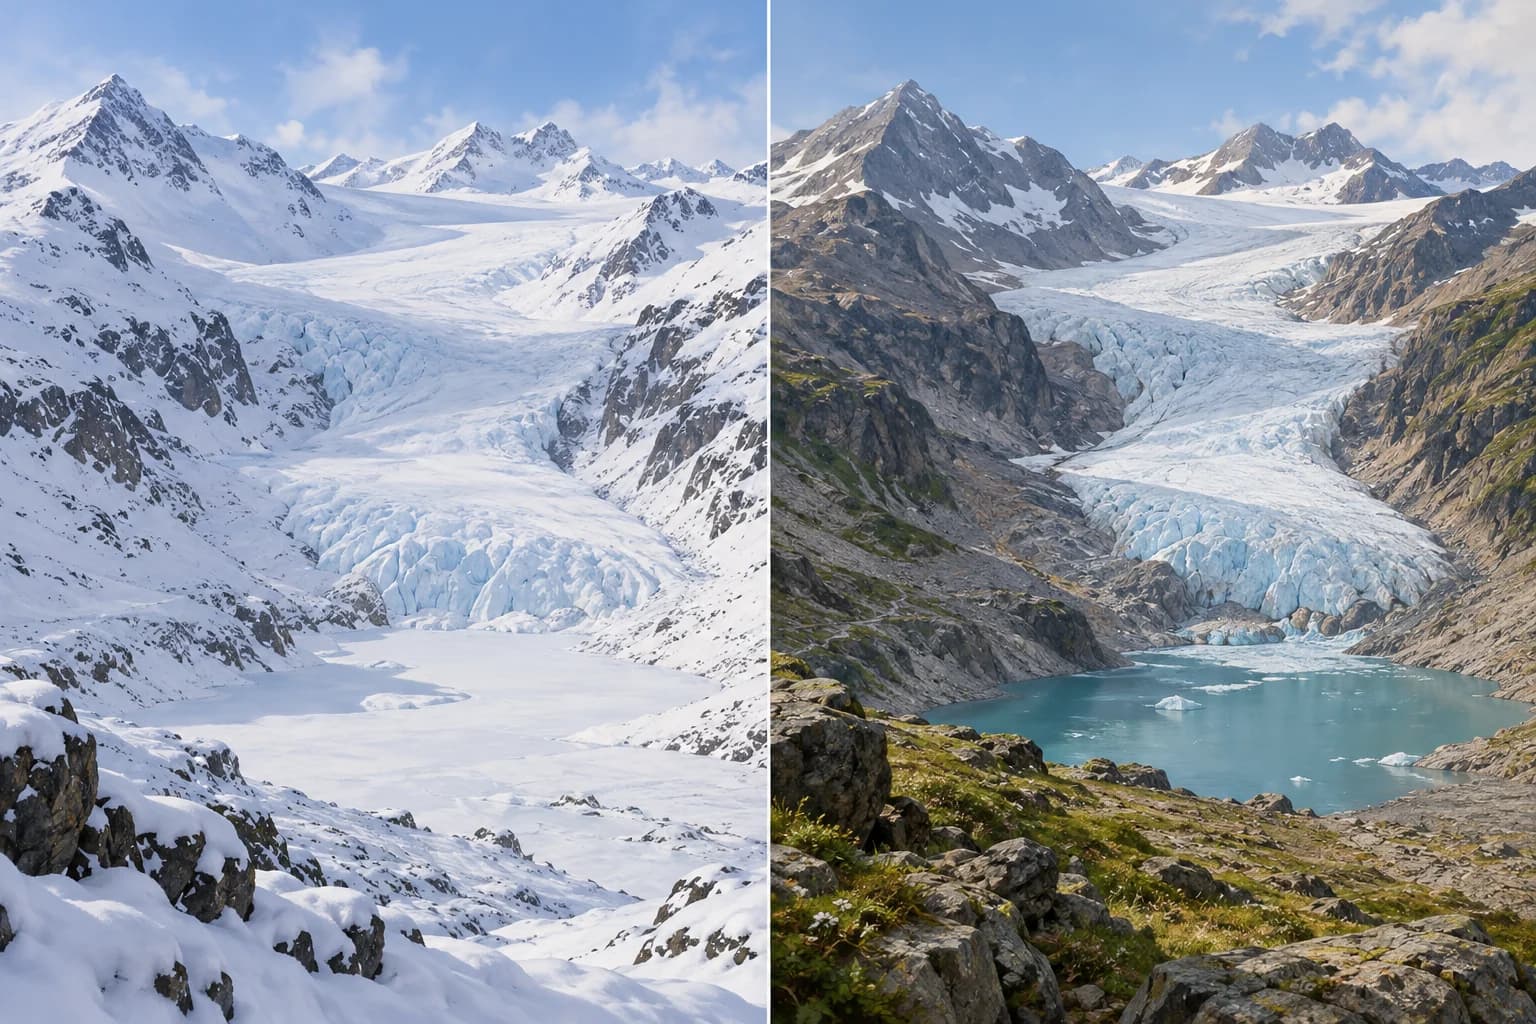
Seasonal snow can spread beyond a glacier onto surrounding slopes and conceal the boundary between ice and rock. Its disappearance between a snowy month and a later summer month may reveal a glacier that was there throughout. That does not make seasonal snow irrelevant to glaciers; it makes the edge of the white patch an unreliable substitute for the edge of the glacier. When the boundary is obscured, write that it is obscured rather than tracing it by guesswork.
USGS explains that its repeat photography project selected historic images with exposed ice and margins unobscured by seasonal snow. Field photography was scheduled for late summer to obtain comparable visibility. NSIDC likewise describes a repeat-photo collection organised around the same viewpoint and time of year. These are methodological choices, not merely aesthetic ones. The purpose is to reduce the chance that ordinary seasonal appearance is mistaken for a longer-term change in the ice body.
Matching the calendar month is a useful first check, but not complete control: recent snowfall and local shading can still differ. Look for visible rock near the margins, check whether one image is freshly snow-covered, and preserve uncertainty wherever the boundary cannot be distinguished. A winter-to-summer pair can explain seasonal cover if honestly labelled; it cannot substitute for a controlled retreat comparison.
Rebuild the viewpoint before judging the outline
Use fixed landscape features as anchors. Compare intersections of ridgelines, the position of a distinctive rock outcrop and the relationship between foreground and background slopes. If these do not align, the camera position or direction may differ. A small change in elevation can reveal ground hidden in the earlier photograph, while a sideways move changes which ridge overlaps the glacier. Enlarging one image until a summit matches will not necessarily correct those perspective differences elsewhere in the frame.
USGS describes relocating photo points using landscape features and adjusting elevation in the field. Its Boulder Glacier example compares photographs from 1910 and 2007 and explains the usefulness of matching background peaks. Those years describe historical observations, not conditions in October 2026. They offer a concrete example of how a repeat pair is assembled, without giving a current annual loss figure or turning every mountain photograph into a scientific measurement.
Different lenses and crops can also change apparent proportions. Begin with full frames whenever available. Keep common landmarks visible, and avoid stretching one image to force a match. If you create a slider, record any alignment and cropping you performed. A pleasing transition should not hide the information that allows the reader to assess whether the comparison is valid.
A reading table for strong and weak photo pairs
The following table is a screening tool, not a numerical confidence score. Its questions can help you decide whether a pair supports a specific visible change, needs a more limited caption, or requires further evidence. Several weaknesses may occur together: a missing date can coincide with a tight crop and fresh snow. Do not average those problems into a reassuring label. State the missing information directly.
Imagine two hypothetical pictures of the same unnamed valley: the first includes winter snow across the upper slopes, while the second shows exposed summer rock. The proper initial description is a difference in snow cover. Now imagine two late-summer pictures from an aligned viewpoint with a clearly identifiable ice edge farther up the valley in the later frame. That second pair can support a statement about visible margin recession, provided provenance and dates are established. Neither hypothetical example supplies an observed percentage change.
A practical editorial decision is to retain the original pair, put the observation dates beside it, and explain any seasonal mismatch. If the available crop removes the landmarks, link the uncropped source and identify that limitation. Readers should not have to infer the conditions from a dramatic headline.
| Check | Stronger comparison | Reason to limit the claim |
|---|---|---|
| Observation dates | Both dates documented in original records | Social posting dates or missing records |
| Season and snow | Comparable late-season visibility of ice margins | Winter snow compared with bare summer slopes |
| Viewpoint | Fixed ridges and foreground features align | Camera position or elevation changes overlap |
| Frame and crop | Shared landmarks remain in full frames | A tighter crop conceals part of the ice |
| Ice boundary | Margin distinguishable from surrounding rock | Snow, cloud or debris obscures the boundary |
| Quantitative claim | Mapped outlines and method supplied separately | An exact area or mass loss inferred from pixels |
Why a photograph does not automatically measure lost ice
A photograph looking across a mountain slope projects a three-dimensional landscape onto a flat image. The number of pixels occupied by ice depends on camera geometry as well as the glacier itself. Without appropriate mapping and calibration, a smaller patch in the picture is not a measured percentage reduction in glacier area. Thickness is another dimension again: a photograph can show exposed rock or a changed surface without measuring the complete ice volume.
USGS educational material distinguishes qualitative repeat photographs from quantitative area observations using aerial and satellite imagery. This distinction is especially useful when a post turns a visual comparison into an exact percentage. Ask where the mapped outlines, dates, method and uncertainty are documented. If the post supplies only the photographs, quote neither a precise area loss nor a mass loss as if you calculated it from the collage.
For a stronger explanation, look for independently documented outlines or a glacier monitoring record covering the relevant place and period. Keep the scales aligned: observations of one glacier do not quantify an entire mountain range, and an archive ending before 2026 does not establish this year's change. A photograph can introduce the evidence beautifully while its accompanying data does the quantitative work.
Make a defensible comparison of your own
Start by locating an archive that identifies both pictures and their rights information. Save the original captions with the images rather than relying on filenames. Then note the dates, season, visible ice boundaries and common landmarks. Separate what you can see from what the caption or monitoring data establishes. If a margin disappears behind cloud, debris or snow, mark the uncertain section instead of completing the line for visual neatness.
For a new repeat photograph, use a safe, accessible viewpoint and consult the historic frame before the visit. Keep enough surrounding landscape in the picture to make future alignment possible. Record the position and date, retain the original file, and describe weather or snow conditions. These steps are an editorial checklist, not instructions to cross unstable terrain or a guarantee that amateur photography produces calibrated glacier measurements.
When publishing, show both frames at a comparable size with any crop explained. Place an observation caption close to the images and distinguish the date of your article from the dates of the photographs. If you cannot verify either frame, publish an explanation of the uncertainty instead of adding a confident retreat claim. That is still useful information for readers trying to interpret the pair.
How to caption a glacier comparison honestly
A weak comparison and a real long-term glacier trend can coexist. Discovering that one circulating image pair is seasonally mismatched does not invalidate controlled glacier records. Equally, knowing that glaciers are changing does not excuse a misleading collage. Evaluate the specific evidence in front of you, then place it within documented observations of that glacier or region.
A defensible caption names the place, gives the two observation dates, describes the visible change and identifies any obstacle to comparison. For a well-documented repeat pair, it may describe a receding visible margin. For a mismatched pair, it may describe changing snow cover and explain why glacier retreat cannot be estimated from those frames alone. Choose the wording after checking the records; do not choose a conclusion first and crop the images to fit it.
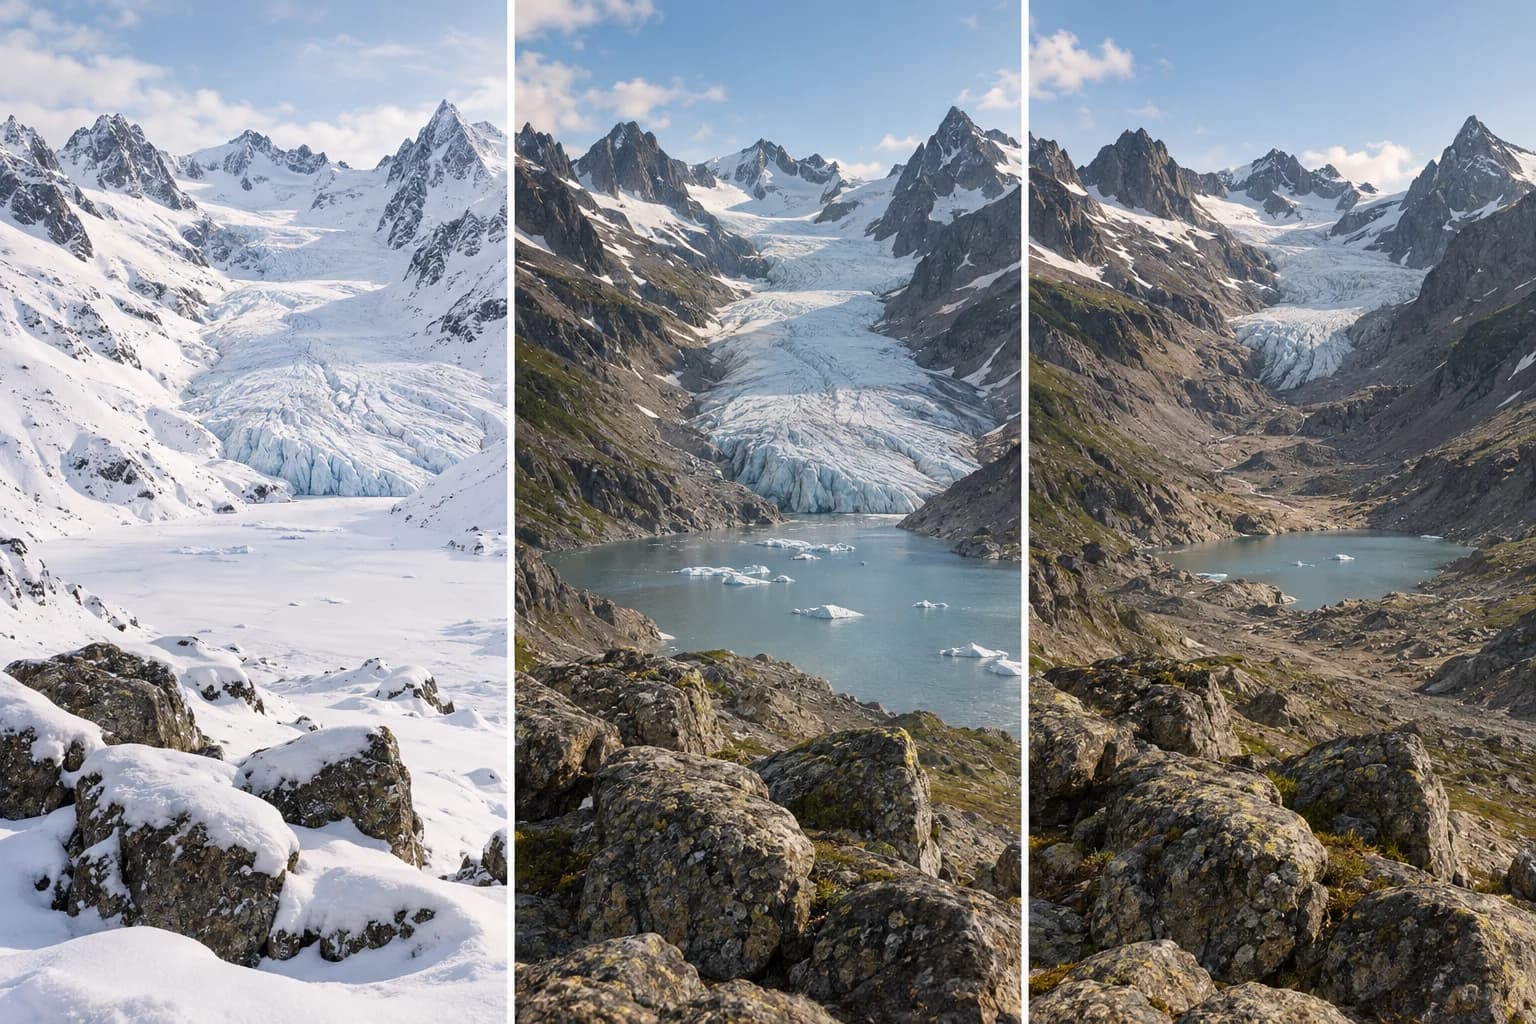
The cover is an AI conceptual painted illustration of an unnamed valley showing how seasonal snow can mask an unchanged ice outline. A separate distant margin contrast is illustrative, not an observed retreat. It is not a photograph of a named glacier, historical evidence or a measurement. Real archival pairs should retain their own dates, credits and reuse terms wherever they appear. This separation lets the illustration teach the mechanism while the verified archive supports claims about actual landscapes.
Questions and answers
Are photos from the same month enough to show glacier retreat?
The same month helps, but it does not guarantee comparable conditions. Recent snowfall, shadows and camera position may still differ. Verify the original dates and location, check fixed landmarks, and identify the actual ice margin. If those conditions are controlled, the pair can support visible recession; exact area or mass changes still require appropriate measurements.
Does a misleading photo pair mean glaciers are not retreating?
No. The quality of one collage and the findings of controlled monitoring are different questions. Rejecting a seasonally mismatched pair improves the accuracy of the specific claim; it does not erase documented glacier changes. Look for a verified repeat-photo archive and the monitoring data for the relevant glacier rather than treating a viral image as the entire evidence base.
Can two photos show the percentage of glacier ice lost?
Usually not from an ordinary side-by-side mountain photograph. Perspective, occlusion and cropping affect the visible patch, and a two-dimensional picture does not measure full ice thickness. A defensible area estimate needs mapped observations and a stated method. A mass estimate needs additional information. Avoid attaching an exact loss percentage to a collage without that evidence.
How should historical glacier photos be dated and credited?
Retain the glacier name, dates of both observations, photographer or institution credits, and the archive link. Check the rights statement for the specific media item, even when the hosting institution commonly supplies public-domain material. Explain any crop or alignment. Label an article published in 2026 separately from photographs observed decades earlier so readers do not mistake their age.