
Answer in brief
Radar satellites send microwave signals and measure what returns, so they can observe when cloud or darkness blocks an optical view. The result needs interpretation: a dark area is not automatically floodwater. Check acquisition dates, the reference image, classification and uncertainty before treating a map as evidence of a change.
Can satellites map a flood when clouds hide it?
Radar satellites can help map floods when clouds obscure an optical view because they measure returning microwave signals rather than the scene’s visible colours. That does not make a radar image an ordinary photograph through cloud or a complete flood diagnosis. Read a water map as an interpretation: what was observed, what was classified and when? An attractive overlay can look definite while concealing those important limits.
Imagine a river passing between fields and a small town. In an optical-style panel, clouds obscure part of the scene. In a radar-style panel, some surfaces appear dark. Those are the conditions of our invented teaching illustration, not a report from a real river. The illustration asks why the panels differ; it cannot establish which houses were flooded, how deep the water was or whether a road remained usable.
Start by reading the caption before the colours. Identify the sensor or product, the observation date and the source. A page published today may contain a historical image or a processed product using earlier observations. The publication date does not move the satellite acquisition forward in time. This simple check prevents a useful archival example from being mistaken for evidence of an unfolding local emergency.
How do optical images and radar signals differ?
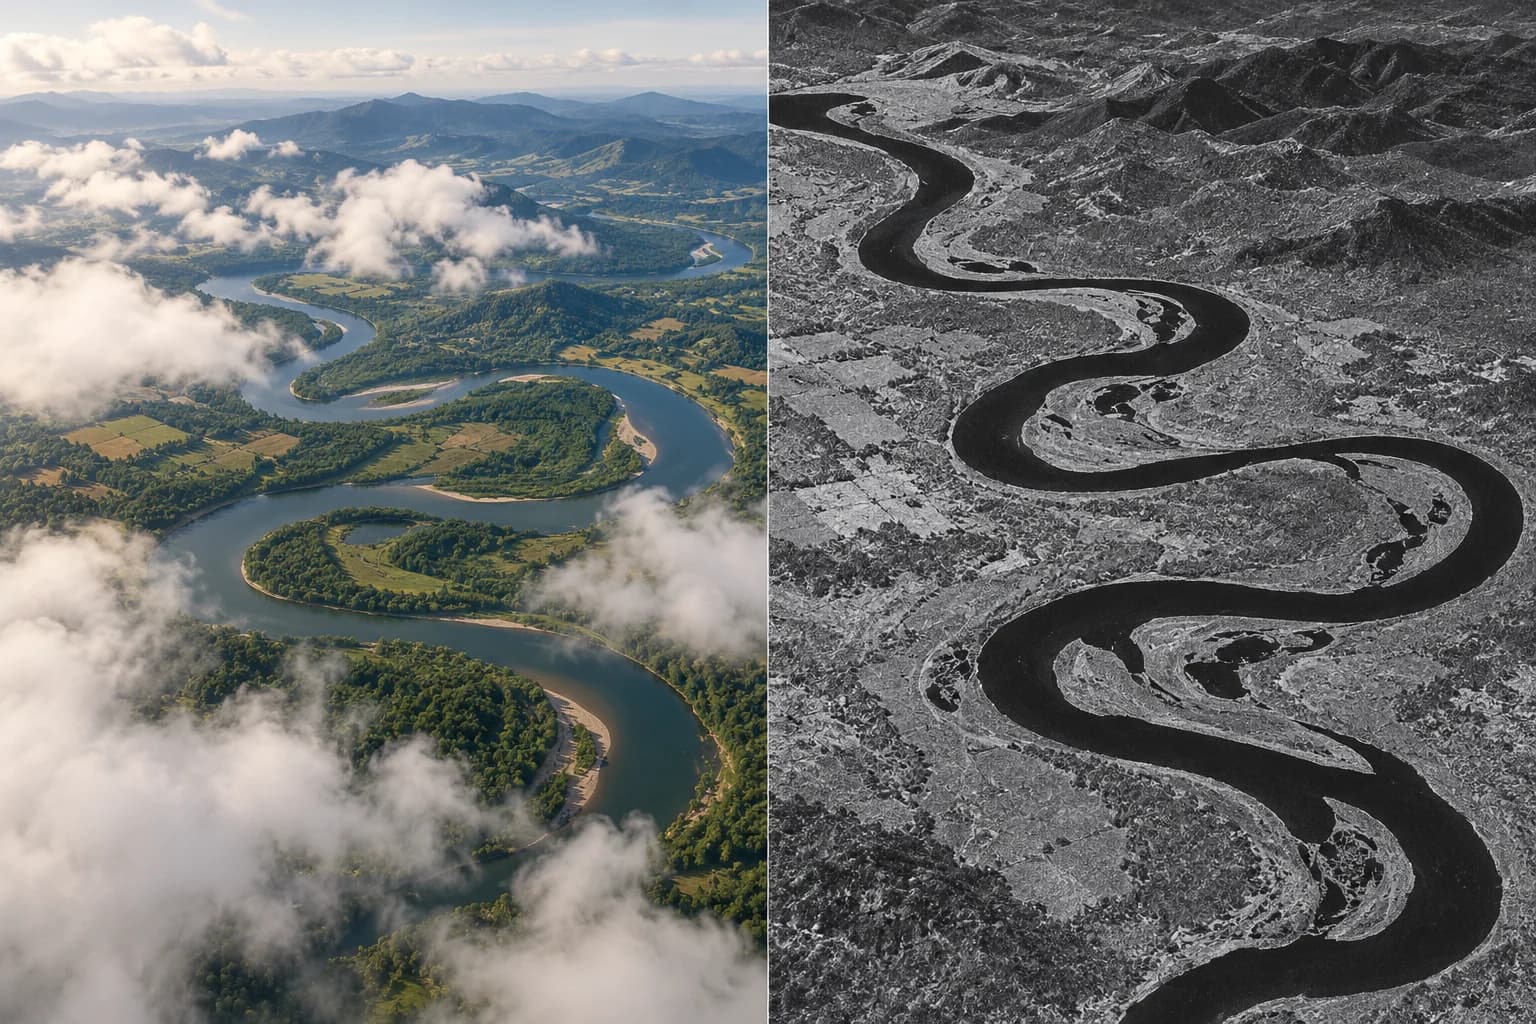
An ordinary-looking optical Earth image records radiation in specified bands; how those bands are displayed also shapes its appearance. A radar instrument transmits a signal and measures the return from the scene. Radar imagery is therefore not an ordinary camera photograph taken through a transparent cloud. It represents a different interaction, and its bright and dark areas need their own explanation before they become a water map.
ESA describes Sentinel-1 as useful for floods because its radar operates through clouds and in darkness. That ability addresses an observation barrier. It does not promise that every flood is seen at its peak, immediately classified or completely resolved. Acquisition opportunities and the selected product still have to match the place and time of the question.
A familiar-colour optical image may be easier for a nonspecialist to recognise, but recognition and reliability are different. A processed radar overlay can improve interpretation while adding analytical choices. Ask for a legend that separates measured signal from inferred class. You do not need to learn every processing step to understand that the coloured water region is an interpretation, rather than literal blue light reflected from a surface.
Which dates belong to the observations?
Before-and-after comparison needs a meaningful reference. A normal river, reservoir or wetland can already contain water before an event. If the later map highlights all water, calling the entire highlighted area “new flooding” changes the question. Look for whether the product describes observed water, newly inundated area or change relative to a stated baseline. Those labels are related but not interchangeable.
Compare acquisition dates, not just publication labels. If the optical view is earlier than the radar observation, part of their difference may be the evolving event rather than the sensors. A water level can change between views. The point is not to dismiss comparison, but to avoid pretending that unmatched times form a controlled experiment proving one sensor found exactly what the other missed.
Also check the geographic frame. Different crops, scales or viewing geometries can make the same area appear more or less dramatic. Identify a stable landmark and read the map scale where available. If no reliable alignment or baseline is supplied, treat the pair as explanatory rather than a measurement of change. Our cover deliberately avoids a named place and date because it contains no such observations.
Does a dark radar area always mean water?
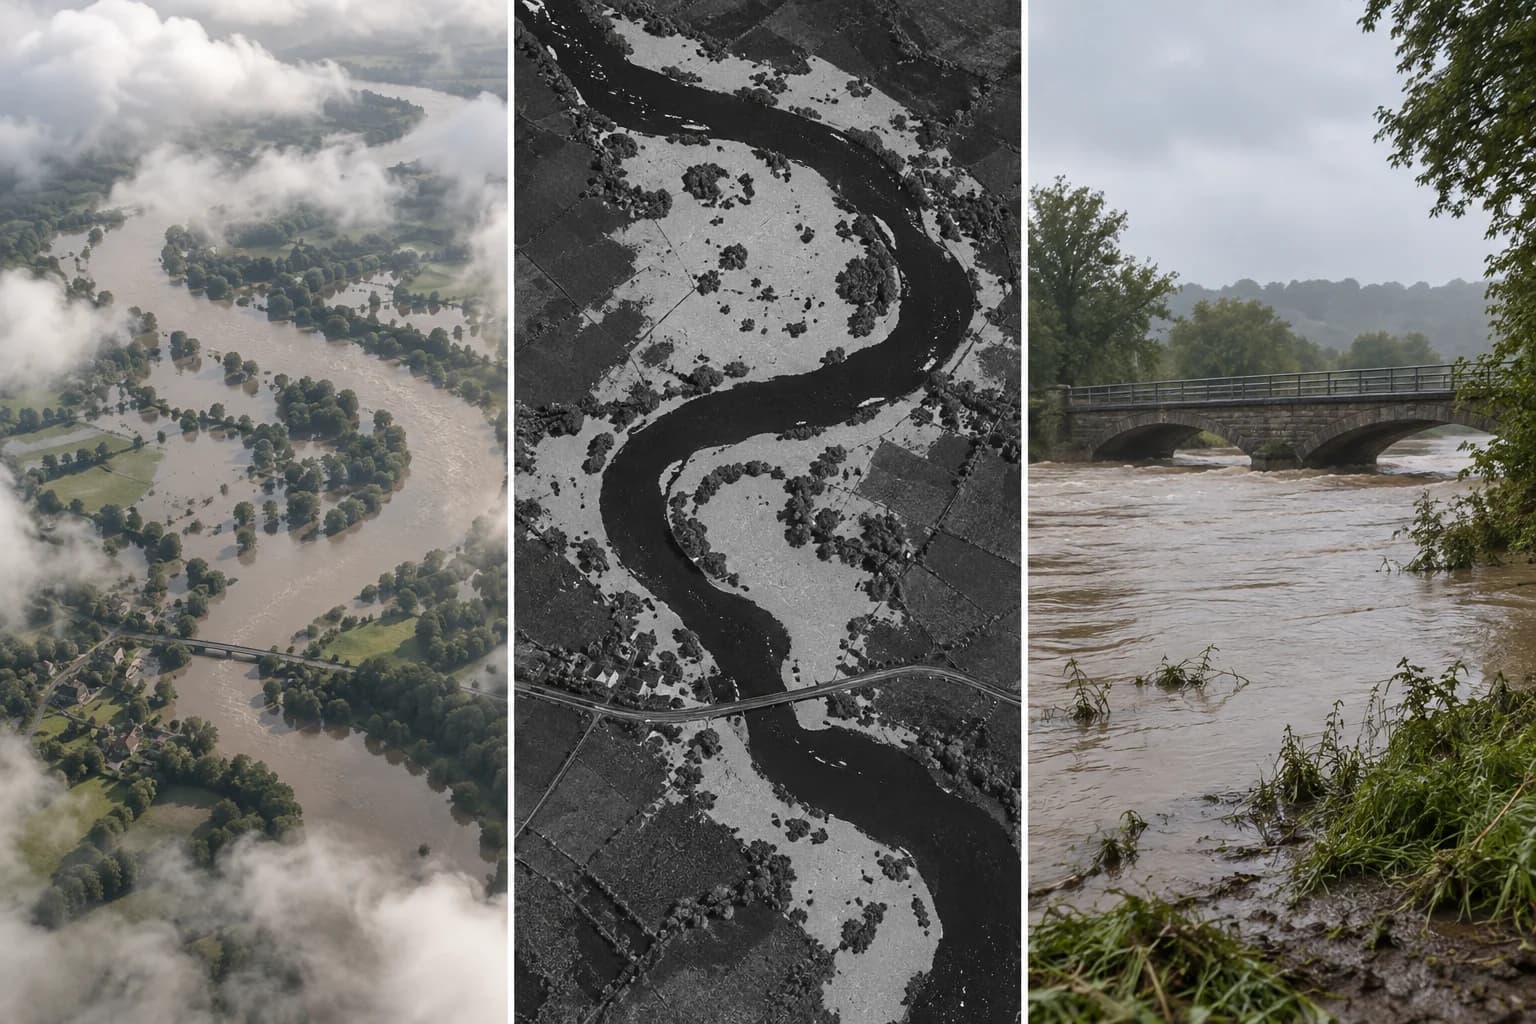
Darkness means a lower return in the displayed radar product, not automatically floodwater. Smooth open water can give a weak return in a suitable geometry, which helps explain a common mapping approach. But an image contains other surfaces and geometric effects. A single dark patch without context does not establish whether water newly appeared there, whether it is permanent or whether the signal is being interpreted correctly.
Vegetation and built-up areas make the scene more complicated than an open field. Water beneath vegetation may not behave like open water, and structures can change the radar response. A USGS coastal study published in 2012 discusses limitations involving vegetation and wind-roughened water. Its evidence concerns that study's environments and historical events, not a guaranteed correction for every contemporary map.
Use those limitations as questions for the product, not as a do-it-yourself classification rule. Does the map distinguish built-up areas or vegetation? Does its method describe uncertain regions? Does the legend include no-data or unclassified pixels? A uniform colour can conceal several confidence levels, while an explicit uncertainty category may provide a more honest result even if the map appears visually less complete.
What can you infer when clouds block the optical view?
Cloud-covered ground is unknown in that view, not necessarily dry. Similarly, a brief flood can occur between useful observations or cover an area the product does not resolve well. NASA's 2011 explanation addresses why some floods do not appear in Earth Observatory imagery. Absence from an image gallery is not evidence that a reported local flood did not happen.
Ask which parts are actually visible. Some optical products provide a separate cloud mask, and a publication may use a crop that hides the extent of missing observation. A clear patch near the river does not make the whole floodplain clear. When reading an illustrated article, distinguish an explanatory image selected for recognition from the full product needed to assess what areas remained unseen.
The reverse caution matters too: a dramatic water-coloured surface in an optical composition needs its band and legend explanation. False-colour display is not deception when identified, but it should not be mistaken for unaided-eye colour. Different band combinations and overlays serve different questions. Compare their meaning rather than deciding which picture is true solely because one resembles a landscape photograph you would take yourself.
Which flood-image product answers your question?
The table separates visibility, change and interpretation. If your question is where water extended beyond a known reference, a dated change product may be more relevant than a scenic overview. If the question is what an individual location looks like, resolution and visible coverage become important. A product valuable at regional scale may not answer a building-level question, even when the published image fills your screen.
Read the accompanying method and source institution's limitations. Distinguish preliminary output from a reviewed assessment where that information is supplied. Do not improve a map's authority by stripping away its uncertainty note when sharing it. A cropped screenshot with no dates or legend can be visually powerful while removing the conditions that made the original product interpretable. Link to the full source rather than supplying confidence through your own caption.
Most importantly, do not turn this reader comparison into evacuation guidance. Water depth, current, road integrity and local safety require information beyond a conceptual overlay. Follow the relevant official emergency instructions for an actual situation. A satellite product can contribute to an assessment; our invented panels contribute only to understanding how claims are made and how a reader can recognise their boundaries.
| Reader question | Optical view | Radar product | Check before concluding |
|---|---|---|---|
| Can this area be observed now? | Cloud and lighting conditions matter | Can address cloud/darkness barriers | Actual acquisition and coverage |
| Is the water new? | Needs a suitable reference | Needs a suitable reference | Baseline and change definition |
| Does darkness mean floodwater? | Display bands/legend define appearance | Low return needs interpretation | Surface, geometry and classification |
| What lies under vegetation? | Visible surface may hide what is below | Response depends on scene and method | Product's stated limits |
| Was a building damaged? | An overview may not resolve that question | Water classification is not damage evidence | Appropriate resolution and other assessment |
| Is this route safe? | Image alone is insufficient | Image alone is insufficient | Current official local safety information |
How to separate an illustration from observed evidence
Our AI-generated cover presents the same unnamed river concept in two panels: cloud-obscured optical style and monochrome radar style with cautious highlighting. The illustrated dark regions are not recorded backscatter, and the highlighted water is not an output from a mapping algorithm. The image is a scientific teaching device, not a dated emergency product or a before-and-after record of a real landscape.
A genuine comparison would retain sensor, acquisition time, geographic extent, processing information and legend. It would name the baseline and state which regions remain uncertain. If a publication cannot provide those basics, you can still enjoy an explanatory image while declining its use as event evidence. Attractive rendering and precise-looking contours do not independently supply provenance or measurement.
When you encounter the next flood pair, ask a short sequence: are the observations comparable in time and place, does the colour mean water or change, and where is uncertainty shown? Then separate those answers from any claim about depth, damage or safe passage. This approach preserves the value of both optical and radar observation without treating either as a complete view of every emergency or borrowing authority from our illustration.
Questions and answers
How can radar satellites observe floods through clouds?
Radar transmits microwave signals and records the return, rather than relying on the optical view of the ground. This helps when clouds or darkness prevent that view. The signals still need processing and interpretation. Check the acquisition date, reference and classification; observing through cloud does not guarantee an immediate or complete map of a flood.
Is every dark area in a radar image floodwater?
No. Dark appearance concerns the displayed return and can have different explanations. Context, surface conditions, geometry and classification matter. Compare with a stated reference and read uncertainty categories. Our conceptual dark regions are invented teaching material, not pixels that establish an actual flooded area.
Can I compare flood images taken on different days?
Yes, if you make the timing difference explicit and avoid claiming a simultaneous controlled comparison. The event itself may change between acquisitions. Read both dates, place and baseline; a publication date does not establish observation time. State whether the pair illustrates sensors or measures a documented change.
Can a satellite flood map tell me which road is safe?
A satellite flood map alone cannot establish whether a road is safe: it does not by itself determine water depth, current or road integrity. Our conceptual illustration contains no real satellite data or local emergency assessment. For an actual event, follow dated official emergency guidance rather than using the illustration as operational advice.